StatPecker
StatPecker delivers fast, secure insights and stunning visuals from your data, making analysis effortless and shareable.
Visit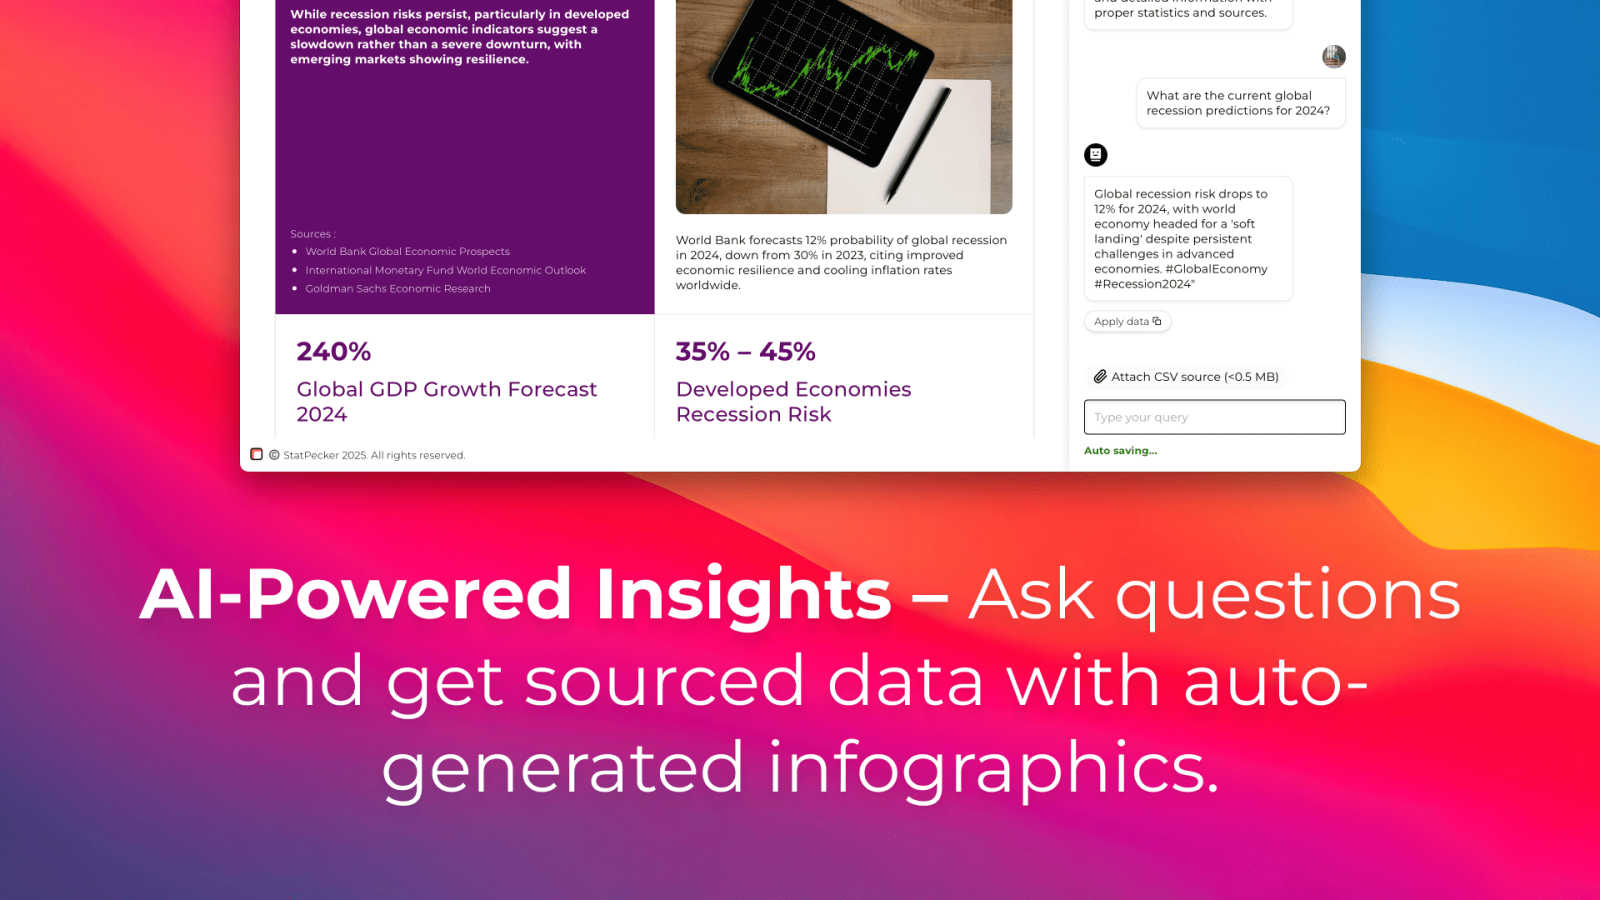
About StatPecker
StatPecker is an innovative AI-powered visual storytelling engine that transforms raw data into stunning infographics effortlessly. Designed for creators, marketers, analysts, and educators who may not be data experts, StatPecker provides a solution to the often mundane task of data presentation. By simply uploading a CSV file or asking a straightforward question, users can generate polished visuals in seconds. This tool eliminates the need for complex software or costly designers, allowing users to focus on the narrative behind their data rather than getting bogged down in technicalities. The platform promises significant time savings, zero production costs beyond the tool itself, and enhanced engagement with content. StatPecker is your go-to resource for turning tedious spreadsheets into captivating visuals, making data comprehension more accessible for everyone.
Features of StatPecker
Ask Your Query
With StatPecker's intuitive interface, you can ask questions directly about your data, receiving instant insights without navigating complex tools. This feature empowers users to extract valuable information quickly, making it ideal for those who need to generate insights on the fly.
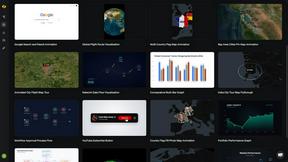
Publish & Embed
StatPecker allows users to create interactive visuals that can be seamlessly integrated into blogs, articles, and websites. This feature enhances the storytelling aspect of your data, enabling you to share insights in a visually appealing format that captures audience attention.
Upload & Analyze CSVs
Easily upload your local CSV files, and let StatPecker handle the analysis. The on-device processing ensures that your data remains secure while you extract key insights without the hassle of traditional spreadsheet software. This feature is perfect for users looking for a quick and private way to visualize their data.
Download & Use Anywhere
Once your infographics are created, you can export them as images for use in reports, presentations, and more. This flexibility allows for easy sharing across different platforms, ensuring that your visual data stories reach the right audience in the format that suits them best.
Use Cases of StatPecker
Data-Driven Marketing
Marketers can utilize StatPecker to create compelling visuals that demonstrate campaign performance, customer insights, or market trends. By presenting data in an engaging format, they can enhance their storytelling and drive audience engagement.
Educational Presentations
Educators can leverage StatPecker to transform complex data into simple, understandable graphics for classroom presentations. This helps students grasp difficult concepts and makes learning more interactive and visually appealing.
Business Reporting
StatPecker is ideal for business analysts who need to present insights to stakeholders. By generating clear and professional infographics, analysts can communicate findings effectively, aiding decision-making processes within their organizations.
Social Media Content Creation
Content creators can use StatPecker to generate visually striking infographics for social media platforms. This capability enables them to share data-driven insights in a format that attracts attention and encourages sharing, enhancing their online presence.
Frequently Asked Questions
How does StatPecker ensure data privacy?
StatPecker prioritizes data security by processing information locally on your device. This means your data never leaves your computer, ensuring that sensitive information remains confidential while you create your visuals.
Can I use StatPecker without any data expertise?
Absolutely! StatPecker is designed for users with varying levels of data expertise. Its user-friendly interface and intuitive features allow anyone to create stunning visuals without needing to navigate complex data analysis tools.
What formats can I export my infographics in?
StatPecker allows users to export their infographics as images, making it easy to include them in reports, presentations, or share them across different platforms. This versatility ensures your visuals are accessible wherever you need them.
Is there a limit on the size of CSV files I can upload?
Yes, StatPecker allows users to upload CSV files of up to 50 MB. This provides ample space for most datasets, enabling users to analyze significant amounts of data without issue.
Explore more in this category:
Similar to StatPecker

UpStart
UpStart Quest is a verified directory and recommendation engine for startup promotion.


BriefIQ
BriefIQ generates complete 18-section SEO briefs in 30 seconds, writes full articles, grades content A-F and auto-improves it.

Easymotion - AI Motion Graphic Generator
AI motion graphics and map animation generator. Create videos, charts, UI explainers, and map animations with AI.

EnsembleData
EnsembleData offers powerful real-time APIs to effortlessly scrape and analyze social media data for smarter business insights.
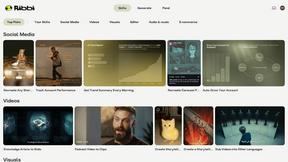
Ribbi
Ribbi is your self-evolving AI partner that automates and enhances social media content creation, driving engagement and growth effortlessly.
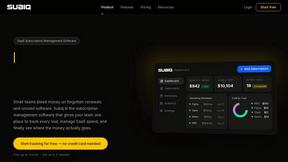
Subiq
Subiq is the most opinionated way to stop bleeding cash on forgotten SaaS subscriptions your small team stopped using months ago.