Dividend Data vs Portfolio Genius
Side-by-side comparison to help you choose the right tool.
Dividend Data
Stop copying stock data manually and instantly pull dividends, prices, and financials directly into your spreadsheets.
Last updated: March 11, 2026
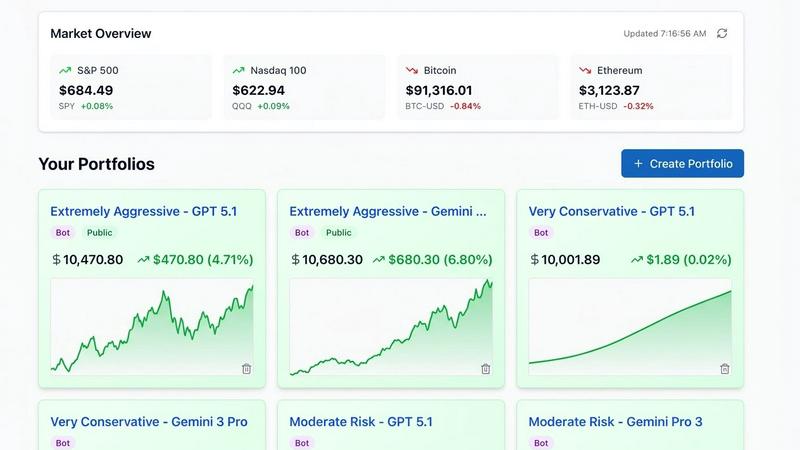
Portfolio Genius
Transform your investment strategy with Portfolio Genius, the AI tool that offers smart trades and real-time analytics.
Last updated: March 1, 2026
Visual Comparison
Dividend Data

Portfolio Genius
Feature Comparison
Dividend Data
Extensive Spreadsheet Functions
Dividend Data provides 16 custom, intuitive functions that cover virtually every data point a serious investor needs. From DIVIDENDDATA_DIVIDENDS to pull yield and payment dates, to DIVIDENDDATA_RATIOS for PE and debt ratios, and DIVIDENDDATA_METRICS for deep financials like EPS. These formulas act as direct conduits, turning your spreadsheet cells into live data feeds without any coding or complex setup required.
Deep Historical & Fundamental Data
The platform isn't just about today's price. It offers a profound depth of data, including over 30 years of historical price and dividend information. This allows for robust back-testing, long-term trend analysis, and calculating compound growth rates. You get access to complete financial statements, enabling full fundamental analysis on everything from revenue to free cash flow, all within your existing workflow.
Seamless Dual-Platform Integration
A major practical advantage is its native integration with both Google Sheets and Microsoft Excel. Whether your team uses the cloud-based collaboration of Sheets or the advanced power of desktop Excel, Dividend Data works flawlessly. The add-ins are officially listed on the Google Workspace and Microsoft AppSource marketplaces, ensuring security, easy installation, and automatic updates.
AI-Powered Research Assistant
Beyond spreadsheets, the Dividend Data Terminal web app includes a standout feature: the AI Analyst. This is like having a tireless research assistant. You can chat with it to get summaries of company performance, ask for comparisons between stocks, or request explanations of specific financial metrics, significantly speeding up the initial research and due diligence process.
Portfolio Genius
Real-Time Analytics
Stay informed with live market data and comprehensive performance metrics updated in real-time. This feature ensures that you are always aware of how your investments are performing, allowing for timely decision-making.
Smart Trade Management
Easily log and track your trades with this user-friendly feature. Analyze your trading patterns and win rates to improve your strategies, enabling you to make data-driven decisions with confidence.
AI-Powered Portfolio Analysis
This feature leverages artificial intelligence to provide data-driven insights tailored to your risk profile and current market conditions. It helps you understand how to optimize your portfolio for better returns while managing risks effectively.
Portfolio Diversification
Visualize your asset allocation to ensure a balanced and healthy portfolio. This feature provides insights into how your investments are distributed across various asset classes, helping you mitigate risk and achieve your financial goals.
Use Cases
Dividend Data
Building a Dynamic Dividend Dashboard
Create a master portfolio tracker that automatically updates. List your holdings in one column, and use Dividend Data formulas in adjacent columns to pull live data on current price, dividend yield, annual income, and ex-dividend dates. This creates a real-time view of your income stream and portfolio health that refreshes with a simple sheet recalculation.
Screening for Dividend Growth Stocks
Quickly build a custom stock screener directly in Excel or Sheets. Combine Dividend Data functions with native spreadsheet filters to scan for companies meeting specific criteria, such as a dividend yield above 3%, a payout ratio below 60%, and 10+ years of consecutive dividend growth. This turns your spreadsheet into a powerful discovery engine.
Conducting Deep Fundamental Analysis
When researching a single company, use the various functions to pull a complete set of financials into a structured model. Analyze trends in revenue, net income, debt-to-equity, and free cash flow over multiple years. This centralized approach is far more efficient than juggling multiple PDF reports or browser tabs.
Automated Financial Modeling
For investors who build discounted cash flow (DCF) or dividend discount models (DDM), Dividend Data automates the data input stage. Formulas can pull historical EPS growth, current dividend rates, and other vital inputs directly into your model's assumptions, ensuring your valuations are always based on the latest available data.
Portfolio Genius
Novice Investors
For those new to investing, Portfolio Genius offers a straightforward introduction to portfolio management. It provides essential insights and recommendations to help beginners navigate the complexities of the stock market confidently.
Busy Professionals
Time-strapped individuals can rely on Portfolio Genius to manage their investment portfolios efficiently. With automated features and real-time analytics, busy professionals can stay updated on their investments without dedicating extensive time.
Seasoned Traders
Experienced investors can utilize Portfolio Genius to refine their strategies. The platform's advanced AI capabilities allow seasoned traders to analyze market conditions and trends, enabling them to make more informed trading decisions.
Educational Tool for Students
Portfolio Genius can serve as an educational resource for students and aspiring investors. By demonstrating AI-driven portfolio management, it provides valuable insights into investment strategies and market dynamics.
Overview
About Dividend Data
Dividend Data is a game-changer for any investor who lives in spreadsheets. Forget about clunky APIs, expensive data terminals, or the soul-crushing tedium of manual copy-pasting from financial websites. This tool brings institutional-grade stock market data directly into your native environment: Google Sheets and Microsoft Excel. With over 30 years of historical data for more than 80,000 tickers, it transforms your spreadsheet into a powerful, live-updating research terminal. The magic lies in its simplicity—you just type a plain-English custom formula like =DIVIDENDDATA_DIVIDENDS("MSFT"), and instantly, the forward annual dividend, yield, or the next ex-date appears. Built by a dividend investor for dividend investors, its core focus is on the metrics that matter most for fundamental and income-focused analysis: dividends, payout ratios, growth rates, full financial statements, and key valuation ratios. What truly sets it apart is its generous, no-strings-attached free tier offering 2,500 monthly credits that never expire, making professional-grade data accessible to everyone. This is the tool for the self-directed investor who demands depth, reliability, and efficiency without the institutional price tag.
About Portfolio Genius
Portfolio Genius is an advanced AI-powered investment advisor engineered to transform how individuals manage their investment portfolios. It harnesses the power of artificial intelligence to analyze real-time market trends, relevant news, and your existing financial holdings, delivering personalized trade suggestions that align with your investment strategy. Whether you're just starting out as a novice investor or possess the expertise of a seasoned trader, Portfolio Genius adapts to your unique needs, providing tailored insights and recommendations. The platform's primary value proposition is its ability to simplify complex portfolio management tasks, enabling users to make informed decisions swiftly. With features like real-time analytics, automated trading options, and an intuitive conversational interface, Portfolio Genius empowers individual investors and busy professionals alike, helping them to optimize their investment strategies with cutting-edge AI-driven insights.
Frequently Asked Questions
Dividend Data FAQ
Is there really a free plan that doesn't expire?
Yes, absolutely. This is one of Dividend Data's most user-friendly policies. The free plan offers 2,500 credits per month, and it does not expire or require a credit card to start. You can use it indefinitely for light to moderate analysis, which is perfect for tracking a personal portfolio or researching a handful of stocks each month.
How do the credits work?
Each cell you populate with a Dividend Data formula consumes one credit, regardless of the amount of historical data that function returns. For example, =DIVIDENDDATA_DIVIDENDS("AAPL", "fwd_yield") uses one credit to fetch that single data point. The 2,500 free credits reset monthly, providing a substantial amount of data for individual investors.
What's the difference between the Spreadsheet Add-in and the PRO Terminal?
The Spreadsheet Add-in is for getting data directly into Excel or Google Sheets. The PRO Terminal is a separate, powerful web application with advanced data visualizations, the AI Analyst chat feature, and automated portfolio tracking with linked broker accounts. They are complementary products; many users start with the spreadsheet tool and graduate to the Terminal for enhanced research.
How current is the data provided?
The data is highly current, with key metrics like stock prices updating near real-time. Fundamental data like earnings and financial statements are updated shortly after companies report, typically aligning with standard financial data providers. The average response time for a data pull is a swift 0.84 seconds.
Portfolio Genius FAQ
Does Portfolio Genius provide investment advice?
No, Portfolio Genius is primarily a portfolio tracking and analytics platform. It offers educational and informational analysis to enhance your understanding of investment strategies but does not provide personalized investment advice.
How does Portfolio Genius ensure data security?
Portfolio Genius employs bank-grade security measures to protect your data. Your information is encrypted and safeguarded with enterprise-level security standards, ensuring your portfolio data remains confidential and secure.
Can I create a portfolio without signing up?
Yes, you can create a hypothetical portfolio without needing to sign up. This allows users to explore how Portfolio Genius analyzes different portfolio compositions based on their investment interests.
What kind of assets can I track with Portfolio Genius?
Portfolio Genius allows users to track a variety of assets, including stocks, ETFs, and cryptocurrencies from major exchanges worldwide, all within a single unified dashboard for comprehensive portfolio management.
Alternatives
Dividend Data Alternatives
Dividend Data is a specialized tool for investors, bringing decades of stock market data directly into spreadsheets. It falls into the category of financial data add-ons, designed specifically for those analyzing dividends and company fundamentals without needing to code. Users often look for alternatives for a few key reasons. Pricing is a major factor, as some services can be prohibitively expensive. Others might need different features, like real-time data or broader market coverage, or they may require a solution that works exclusively on one platform like Excel or through a dedicated API. When evaluating other options, focus on your core needs. Consider the depth and history of the dividend data, the total cost relative to your usage, and how seamlessly it integrates with your existing workflow in Sheets or Excel. The best tool is the one that delivers the specific metrics you need without complexity or hidden fees.
Portfolio Genius Alternatives
Portfolio Genius is an AI-driven investment advisor that simplifies portfolio management through intelligent trade suggestions and real-time analytics. As a tool designed for both novice investors and seasoned traders, it leverages advanced technology to analyze market trends and individual holdings, providing personalized insights to enhance the investment experience. Users often seek alternatives to Portfolio Genius for various reasons, including pricing, specific feature needs, or preferences regarding user interface and functionality. When choosing an alternative, it's essential to consider factors such as the types of investment strategies supported, the flexibility of trading options, and the overall user experience to ensure that it aligns with your personal investing goals.