Dividend Data
Stop copying stock data manually and instantly pull dividends, prices, and financials directly into your spreadsheets.
Visit
About Dividend Data
Dividend Data is a game-changer for any investor who lives in spreadsheets. Forget about clunky APIs, expensive data terminals, or the soul-crushing tedium of manual copy-pasting from financial websites. This tool brings institutional-grade stock market data directly into your native environment: Google Sheets and Microsoft Excel. With over 30 years of historical data for more than 80,000 tickers, it transforms your spreadsheet into a powerful, live-updating research terminal. The magic lies in its simplicity—you just type a plain-English custom formula like =DIVIDENDDATA_DIVIDENDS("MSFT"), and instantly, the forward annual dividend, yield, or the next ex-date appears. Built by a dividend investor for dividend investors, its core focus is on the metrics that matter most for fundamental and income-focused analysis: dividends, payout ratios, growth rates, full financial statements, and key valuation ratios. What truly sets it apart is its generous, no-strings-attached free tier offering 2,500 monthly credits that never expire, making professional-grade data accessible to everyone. This is the tool for the self-directed investor who demands depth, reliability, and efficiency without the institutional price tag.
Features of Dividend Data
Extensive Spreadsheet Functions
Dividend Data provides 16 custom, intuitive functions that cover virtually every data point a serious investor needs. From DIVIDENDDATA_DIVIDENDS to pull yield and payment dates, to DIVIDENDDATA_RATIOS for PE and debt ratios, and DIVIDENDDATA_METRICS for deep financials like EPS. These formulas act as direct conduits, turning your spreadsheet cells into live data feeds without any coding or complex setup required.
Deep Historical & Fundamental Data
The platform isn't just about today's price. It offers a profound depth of data, including over 30 years of historical price and dividend information. This allows for robust back-testing, long-term trend analysis, and calculating compound growth rates. You get access to complete financial statements, enabling full fundamental analysis on everything from revenue to free cash flow, all within your existing workflow.
Seamless Dual-Platform Integration
A major practical advantage is its native integration with both Google Sheets and Microsoft Excel. Whether your team uses the cloud-based collaboration of Sheets or the advanced power of desktop Excel, Dividend Data works flawlessly. The add-ins are officially listed on the Google Workspace and Microsoft AppSource marketplaces, ensuring security, easy installation, and automatic updates.
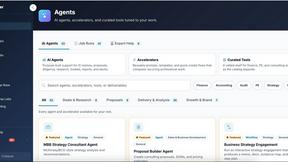
AI-Powered Research Assistant
Beyond spreadsheets, the Dividend Data Terminal web app includes a standout feature: the AI Analyst. This is like having a tireless research assistant. You can chat with it to get summaries of company performance, ask for comparisons between stocks, or request explanations of specific financial metrics, significantly speeding up the initial research and due diligence process.
Use Cases of Dividend Data
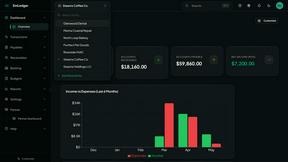
Building a Dynamic Dividend Dashboard
Create a master portfolio tracker that automatically updates. List your holdings in one column, and use Dividend Data formulas in adjacent columns to pull live data on current price, dividend yield, annual income, and ex-dividend dates. This creates a real-time view of your income stream and portfolio health that refreshes with a simple sheet recalculation.
Screening for Dividend Growth Stocks
Quickly build a custom stock screener directly in Excel or Sheets. Combine Dividend Data functions with native spreadsheet filters to scan for companies meeting specific criteria, such as a dividend yield above 3%, a payout ratio below 60%, and 10+ years of consecutive dividend growth. This turns your spreadsheet into a powerful discovery engine.
Conducting Deep Fundamental Analysis
When researching a single company, use the various functions to pull a complete set of financials into a structured model. Analyze trends in revenue, net income, debt-to-equity, and free cash flow over multiple years. This centralized approach is far more efficient than juggling multiple PDF reports or browser tabs.
Automated Financial Modeling
For investors who build discounted cash flow (DCF) or dividend discount models (DDM), Dividend Data automates the data input stage. Formulas can pull historical EPS growth, current dividend rates, and other vital inputs directly into your model's assumptions, ensuring your valuations are always based on the latest available data.
Frequently Asked Questions
Is there really a free plan that doesn't expire?
Yes, absolutely. This is one of Dividend Data's most user-friendly policies. The free plan offers 2,500 credits per month, and it does not expire or require a credit card to start. You can use it indefinitely for light to moderate analysis, which is perfect for tracking a personal portfolio or researching a handful of stocks each month.
How do the credits work?
Each cell you populate with a Dividend Data formula consumes one credit, regardless of the amount of historical data that function returns. For example, =DIVIDENDDATA_DIVIDENDS("AAPL", "fwd_yield") uses one credit to fetch that single data point. The 2,500 free credits reset monthly, providing a substantial amount of data for individual investors.
What's the difference between the Spreadsheet Add-in and the PRO Terminal?
The Spreadsheet Add-in is for getting data directly into Excel or Google Sheets. The PRO Terminal is a separate, powerful web application with advanced data visualizations, the AI Analyst chat feature, and automated portfolio tracking with linked broker accounts. They are complementary products; many users start with the spreadsheet tool and graduate to the Terminal for enhanced research.
How current is the data provided?
The data is highly current, with key metrics like stock prices updating near real-time. Fundamental data like earnings and financial statements are updated shortly after companies report, typically aligning with standard financial data providers. The average response time for a data pull is a swift 0.84 seconds.
Similar to Dividend Data
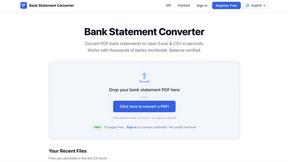
Bank Statement Engine
Free tool to convert PDF bank statements to Excel, CSV, JSON, QBO, OFX and QIF. No signup, no limits.


Decker
Decker is my favorite deliverable OS that turns consultant work into AI training data, letting you build, learn, and earn from every deck and memo.

Liners Africa
Liners Africa is my go-to curated directory of African software, offering human and AI-backed reviews and alternatives so you never waste time on the.