Fusedash vs StatPecker
Side-by-side comparison to help you choose the right tool.
Fusedash transforms raw data into intuitive dashboards and charts, empowering teams to act on insights instantly.
Last updated: March 4, 2026

StatPecker
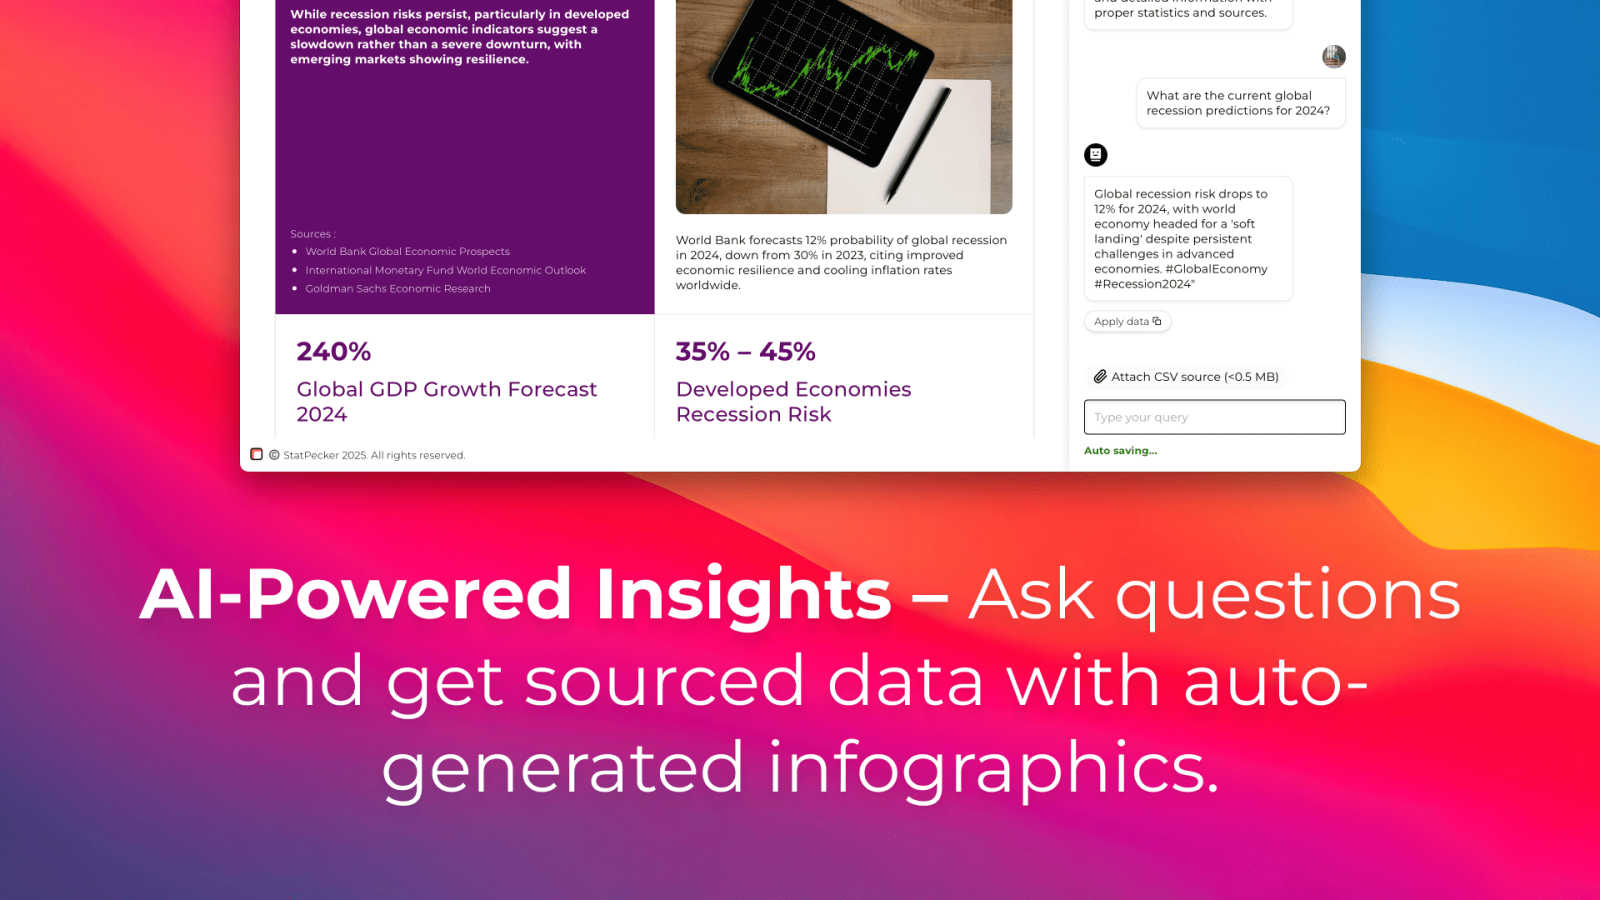
StatPecker delivers fast, secure insights and stunning visuals from your data, making analysis effortless and shareable.
Last updated: March 1, 2026
Visual Comparison
Fusedash

StatPecker
Feature Comparison
Fusedash
Flexible Views
Fusedash allows you to create tailored dashboard views for different audiences. Whether you need dashboards, charts, maps, or report-style presentations, you can customize layouts, filters, and time ranges, ensuring stakeholders see exactly what they need without unnecessary back and forth.
AI Chart Generator
With the AI Chart Generator, you can quickly create clear visuals from your CSV files or APIs in mere minutes. This feature enables you to select the right chart type, apply comparisons, and refine labels, streamlining the reporting process while ensuring that your charts effectively convey the intended narrative.
Dashboard Software
Fusedash provides a comprehensive workspace for dashboards and reporting, allowing teams to combine KPIs with narrative elements. This integration helps stakeholders understand not just the numbers, but also the context behind them, reducing the risk of conflicting information and keeping teams aligned.
AI Chat
The Smart Chat feature leverages AI to facilitate data exploration. Users can ask questions in plain language, receive suggestions for relevant metrics and charts, and easily transform insights into shareable dashboard views, making data analysis more intuitive and collaborative.
StatPecker
Ask Your Query
With StatPecker's intuitive interface, you can ask questions directly about your data, receiving instant insights without navigating complex tools. This feature empowers users to extract valuable information quickly, making it ideal for those who need to generate insights on the fly.
Publish & Embed
StatPecker allows users to create interactive visuals that can be seamlessly integrated into blogs, articles, and websites. This feature enhances the storytelling aspect of your data, enabling you to share insights in a visually appealing format that captures audience attention.
Upload & Analyze CSVs
Easily upload your local CSV files, and let StatPecker handle the analysis. The on-device processing ensures that your data remains secure while you extract key insights without the hassle of traditional spreadsheet software. This feature is perfect for users looking for a quick and private way to visualize their data.
Download & Use Anywhere
Once your infographics are created, you can export them as images for use in reports, presentations, and more. This flexibility allows for easy sharing across different platforms, ensuring that your visual data stories reach the right audience in the format that suits them best.
Use Cases
Fusedash
Marketing Performance Tracking
Marketing teams can utilize Fusedash to monitor campaign performance in real-time. By visualizing key metrics and KPIs in customizable dashboards, marketers can quickly assess what strategies are working and adjust their tactics accordingly.
Sales Insights and Forecasting
Sales departments can leverage Fusedash to create detailed reports and dashboards that highlight sales trends and forecasts. With the ability to drill down into segments and time periods, sales teams can better understand their performance and make data-driven decisions.
Operational Efficiency Monitoring
Operations teams can use Fusedash to track efficiency metrics, such as production rates or supply chain performance. The platform's ability to visualize data from various sources allows for comprehensive analysis, leading to improved operational strategies.
Financial Reporting and Analysis
Finance teams can benefit from Fusedash by streamlining their reporting processes. By consolidating financial data into a single view and utilizing narrative reporting alongside traditional dashboards, finance professionals can provide stakeholders with clear insights and actionable recommendations.
StatPecker
Data-Driven Marketing
Marketers can utilize StatPecker to create compelling visuals that demonstrate campaign performance, customer insights, or market trends. By presenting data in an engaging format, they can enhance their storytelling and drive audience engagement.
Educational Presentations
Educators can leverage StatPecker to transform complex data into simple, understandable graphics for classroom presentations. This helps students grasp difficult concepts and makes learning more interactive and visually appealing.
Business Reporting
StatPecker is ideal for business analysts who need to present insights to stakeholders. By generating clear and professional infographics, analysts can communicate findings effectively, aiding decision-making processes within their organizations.
Social Media Content Creation
Content creators can use StatPecker to generate visually striking infographics for social media platforms. This capability enables them to share data-driven insights in a format that attracts attention and encourages sharing, enhancing their online presence.
Overview
About Fusedash
Fusedash is an innovative AI-powered data visualization platform that revolutionizes how teams interpret and act on their data. Designed for organizations that struggle with disparate data sources and inefficient reporting processes, Fusedash offers a unified workspace for creating insightful dashboards, interactive charts, detailed maps, and narrative reports. The platform stands out by allowing users to define key performance indicators (KPIs) and metrics once, ensuring that everyone across departments is aligned on the same trusted data. This eliminates the frustration of conflicting reports and manual data compilations. Whether you are in leadership, marketing, or operations, Fusedash empowers you to monitor real-time data and understand the underlying trends driving your business decisions. By integrating AI features such as natural language data chat and smart visualization assistance, Fusedash not only accelerates data exploration but also enhances accessibility, transforming raw data into actionable insights that foster alignment and drive strategic initiatives.
About StatPecker
StatPecker is an innovative AI-powered visual storytelling engine that transforms raw data into stunning infographics effortlessly. Designed for creators, marketers, analysts, and educators who may not be data experts, StatPecker provides a solution to the often mundane task of data presentation. By simply uploading a CSV file or asking a straightforward question, users can generate polished visuals in seconds. This tool eliminates the need for complex software or costly designers, allowing users to focus on the narrative behind their data rather than getting bogged down in technicalities. The platform promises significant time savings, zero production costs beyond the tool itself, and enhanced engagement with content. StatPecker is your go-to resource for turning tedious spreadsheets into captivating visuals, making data comprehension more accessible for everyone.
Frequently Asked Questions
Fusedash FAQ
What types of data can I use with Fusedash?
Fusedash supports various data sources, including CSV uploads and API connections. This flexibility allows you to integrate diverse datasets into a unified workspace for comprehensive analysis.
How does Fusedash ensure data consistency across reports?
Fusedash allows users to define KPIs and metrics once and reuse them across dashboards, charts, and reports. This eliminates discrepancies and ensures that all teams are aligned on the same data.
Can I customize the visualizations in Fusedash?
Yes, Fusedash provides extensive customization options for visualizations. You can tailor layouts, filters, and chart types to meet the specific needs of different stakeholders, enhancing the clarity and relevance of your data presentations.
Is there a learning curve for using Fusedash?
Fusedash is designed with user-friendliness in mind, featuring intuitive interfaces and AI-powered tools. While new users may require some time to familiarize themselves, the platform's comprehensive resources and support help facilitate a smooth onboarding process.
StatPecker FAQ
How does StatPecker ensure data privacy?
StatPecker prioritizes data security by processing information locally on your device. This means your data never leaves your computer, ensuring that sensitive information remains confidential while you create your visuals.
Can I use StatPecker without any data expertise?
Absolutely! StatPecker is designed for users with varying levels of data expertise. Its user-friendly interface and intuitive features allow anyone to create stunning visuals without needing to navigate complex data analysis tools.
What formats can I export my infographics in?
StatPecker allows users to export their infographics as images, making it easy to include them in reports, presentations, or share them across different platforms. This versatility ensures your visuals are accessible wherever you need them.
Is there a limit on the size of CSV files I can upload?
Yes, StatPecker allows users to upload CSV files of up to 50 MB. This provides ample space for most datasets, enabling users to analyze significant amounts of data without issue.
Alternatives
Fusedash Alternatives
Fusedash is an AI-powered data visualization platform that enables teams to transform raw data into actionable insights through clear dashboards and charts. As part of the Analytics & Data and Business Intelligence categories, it aims to streamline data reporting and foster alignment across organizations by ensuring that everyone is working from the same set of trusted metrics. Users often seek alternatives to Fusedash for a variety of reasons, including pricing considerations, specific feature sets, or compatibility with their existing platforms. When searching for an alternative, it's essential to assess the platform's ability to deliver real-time data insights, the flexibility in visualizations, and the overall ease of use to ensure it meets your team's unique needs and enhances decision-making processes.
StatPecker Alternatives
StatPecker is an innovative AI-driven tool in the data visualization category, designed to transform raw data into engaging infographics quickly and effortlessly. Users are often drawn to StatPecker for its ability to simplify the process of data storytelling, but they may seek alternatives due to factors like pricing, specific feature sets, or compatibility with their existing platforms. The need for user-friendly interfaces, robust analytics capabilities, and flexible data integration options are essential considerations when exploring alternatives, as these aspects can significantly impact the effectiveness of data communication. --- [{"question": "What is StatPecker?", "answer": "StatPecker is an AI-powered visual storytelling engine that transforms raw data into polished infographics, making data insights accessible and engaging."}, {"question": "Who is StatPecker for?", "answer": "StatPecker is ideal for creators, marketers, analysts, and educators who need to communicate data insights without being data experts."}, {"question": "Is StatPecker free?", "answer": "The content does not specify whether StatPecker is free; users should check the official website for pricing details."}, {"question": "What are the main features of StatPecker?", "answer": "StatPecker features AI-powered query-to-visual capabilities, direct CSV upload and analysis, allowing users to effortlessly create meaningful charts from their data."}]