Fusedash
Fusedash transforms raw data into intuitive dashboards and charts, empowering teams to act on insights instantly.
Visit
About Fusedash
Fusedash is an innovative AI-powered data visualization platform that revolutionizes how teams interpret and act on their data. Designed for organizations that struggle with disparate data sources and inefficient reporting processes, Fusedash offers a unified workspace for creating insightful dashboards, interactive charts, detailed maps, and narrative reports. The platform stands out by allowing users to define key performance indicators (KPIs) and metrics once, ensuring that everyone across departments is aligned on the same trusted data. This eliminates the frustration of conflicting reports and manual data compilations. Whether you are in leadership, marketing, or operations, Fusedash empowers you to monitor real-time data and understand the underlying trends driving your business decisions. By integrating AI features such as natural language data chat and smart visualization assistance, Fusedash not only accelerates data exploration but also enhances accessibility, transforming raw data into actionable insights that foster alignment and drive strategic initiatives.
Features of Fusedash
Flexible Views
Fusedash allows you to create tailored dashboard views for different audiences. Whether you need dashboards, charts, maps, or report-style presentations, you can customize layouts, filters, and time ranges, ensuring stakeholders see exactly what they need without unnecessary back and forth.
AI Chart Generator
With the AI Chart Generator, you can quickly create clear visuals from your CSV files or APIs in mere minutes. This feature enables you to select the right chart type, apply comparisons, and refine labels, streamlining the reporting process while ensuring that your charts effectively convey the intended narrative.
Dashboard Software
Fusedash provides a comprehensive workspace for dashboards and reporting, allowing teams to combine KPIs with narrative elements. This integration helps stakeholders understand not just the numbers, but also the context behind them, reducing the risk of conflicting information and keeping teams aligned.
AI Chat
The Smart Chat feature leverages AI to facilitate data exploration. Users can ask questions in plain language, receive suggestions for relevant metrics and charts, and easily transform insights into shareable dashboard views, making data analysis more intuitive and collaborative.
Use Cases of Fusedash
Marketing Performance Tracking
Marketing teams can utilize Fusedash to monitor campaign performance in real-time. By visualizing key metrics and KPIs in customizable dashboards, marketers can quickly assess what strategies are working and adjust their tactics accordingly.
Sales Insights and Forecasting
Sales departments can leverage Fusedash to create detailed reports and dashboards that highlight sales trends and forecasts. With the ability to drill down into segments and time periods, sales teams can better understand their performance and make data-driven decisions.
Operational Efficiency Monitoring
Operations teams can use Fusedash to track efficiency metrics, such as production rates or supply chain performance. The platform's ability to visualize data from various sources allows for comprehensive analysis, leading to improved operational strategies.
Financial Reporting and Analysis
Finance teams can benefit from Fusedash by streamlining their reporting processes. By consolidating financial data into a single view and utilizing narrative reporting alongside traditional dashboards, finance professionals can provide stakeholders with clear insights and actionable recommendations.
Frequently Asked Questions
What types of data can I use with Fusedash?
Fusedash supports various data sources, including CSV uploads and API connections. This flexibility allows you to integrate diverse datasets into a unified workspace for comprehensive analysis.
How does Fusedash ensure data consistency across reports?
Fusedash allows users to define KPIs and metrics once and reuse them across dashboards, charts, and reports. This eliminates discrepancies and ensures that all teams are aligned on the same data.
Can I customize the visualizations in Fusedash?
Yes, Fusedash provides extensive customization options for visualizations. You can tailor layouts, filters, and chart types to meet the specific needs of different stakeholders, enhancing the clarity and relevance of your data presentations.
Is there a learning curve for using Fusedash?
Fusedash is designed with user-friendliness in mind, featuring intuitive interfaces and AI-powered tools. While new users may require some time to familiarize themselves, the platform's comprehensive resources and support help facilitate a smooth onboarding process.
Explore more in this category:
Similar to Fusedash
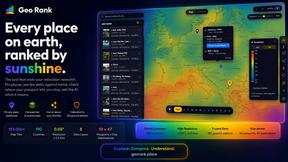
GeoRank
Planning a relocation or long-term stay abroad? Compare places on sunshine, cost, tax, visa and stay duration, then ask AI about your shortlist.

Video2URL
Turn video files into private, trackable share links in seconds.
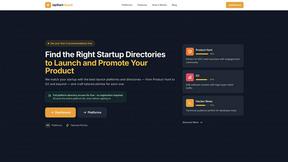
UpStart
UpStart Quest is a verified directory and recommendation engine for startup promotion.
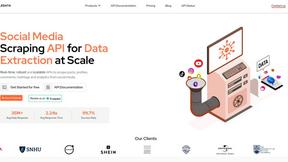
EnsembleData
EnsembleData offers powerful real-time APIs to effortlessly scrape and analyze social media data for smarter business insights.
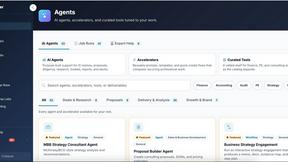
Decker
Decker is my favorite deliverable OS that turns consultant work into AI training data, letting you build, learn, and earn from every deck and memo.
Subiq
Subiq is the most opinionated way to stop bleeding cash on forgotten SaaS subscriptions your small team stopped using months ago.

shhr.ink
Shhr.ink is my favorite free URL shortener with click analytics, QR codes, and link management no credit card required.
GhostlyX Privacy-First Web Analytics
GhostlyX offers cookie-free web analytics that provide actionable insights while prioritizing user privacy and GDPR compliance.