LoadTester
The most opinionated load testing tool I trust for HTTP and API performance, delivering live analytics and thresholds without infrastructure.
Visit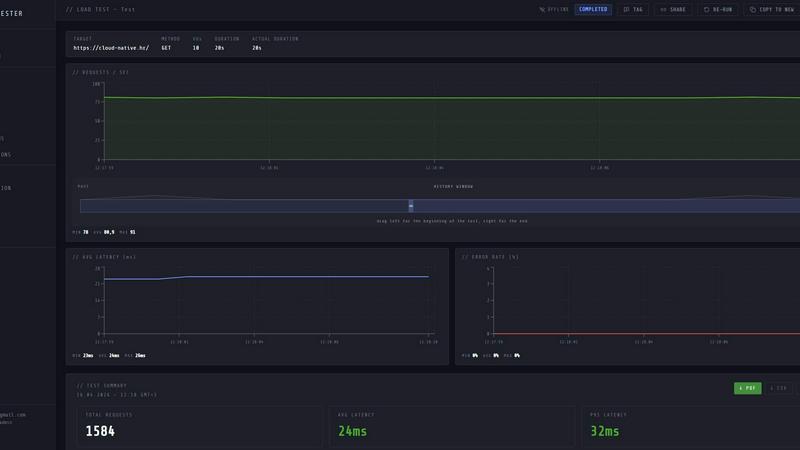
About LoadTester
LoadTester is a modern, cloud-native HTTP and API load testing tool built by Cloud Native d.o.o., designed specifically for engineering teams who want repeatable performance checks without the operational overhead. If you have ever spent hours provisioning servers, configuring JMeter clusters, or wrestling with infrastructure just to run a simple load test, this tool is for you. LoadTester eliminates that entire painful process. You can create a test, choose between virtual users (VUs) or requests per second (RPS), and launch it from your browser or directly from your CI/CD pipeline. Within seconds, you get live analytics tracking throughput, latency (p50, p95, p99), error rates, and active workers. It supports up to 10,000 VUs and 10,000 RPS per test, with a cold start time of under three seconds. The tool includes smart auto-stop thresholds, scheduled baselines, run-to-run comparisons, and export capabilities. It is built for developers, SREs, QA engineers, and platform teams who need to catch performance regressions before users notice. LoadTester is opinionated about simplicity: no bloated setup, no platform ceremony, just fast, reliable performance data you can act on. The free plan lets you start immediately, and the paid tiers unlock advanced features like higher concurrency, longer durations, and team collaboration. This is my personal favorite for teams that want infrastructure-free, production-grade load testing.
Features of LoadTester
Instant Execution with Distributed Workers
LoadTester starts distributed load tests in under three seconds from the moment you hit run. There is no infrastructure to provision, no worker orchestration to manage, and no scheduling headaches. The platform automatically scales workers based on your test configuration, dispatching them to generate traffic from multiple locations. This means your team focuses entirely on interpreting results and fixing performance issues, not on managing test infrastructure. The queue time is effectively zero, so your tests start immediately.
Live Telemetry and Real-Time Analytics
While your test is running, LoadTester streams live data directly to your browser. You can watch requests per second, latency distributions (p50, p95, p99), active virtual users, and error counts update in real time. This is not a dashboard that refreshes every five minutes after the run ends; it is a live feed that lets you spot bottlenecks and anomalies as they happen. The latency distribution chart over the last 60 seconds gives you an immediate visual understanding of how your application is performing under load.
Smart Auto-Stop Thresholds
You can define failure and latency thresholds before a test starts, and LoadTester will automatically stop the test if those thresholds are breached. For example, you can set a rule that stops the test if p95 latency exceeds 400 milliseconds or if the error rate goes above 2%. This prevents wasted test time and resources when your application is clearly struggling. You can also set regression thresholds that compare against a baseline run, triggering notifications via Slack or email if performance degrades by more than 15 percent.
CI/CD Ready with Webhooks and Scheduled Tests
LoadTester integrates directly into your development workflow. You can schedule tests to run daily at specific times, trigger them via webhooks from your release pipeline, or run them manually from the dashboard. The tool sends completion notifications to Slack, email, or any custom endpoint. This makes it easy to add performance gates to your deployment process, ensuring that no regression makes it to production. The API access allows you to programmatically create, launch, and review tests, giving platform teams full control over their performance testing lifecycle.
Use Cases of LoadTester
Pre-Deployment Performance Gates for CI/CD Pipelines
Before every production deployment, your team can run a predefined load test against the staging environment. LoadTester integrates with your CI/CD system via webhooks or API calls, automatically triggering a test on every pull request merge. If the test fails due to latency or error rate thresholds being breached, the pipeline can be halted, preventing a degraded user experience from reaching customers. This shifts performance testing left, catching regressions before they impact real users.
Spike Testing for E-Commerce Checkout Flows
For e-commerce platforms, the checkout endpoint is mission-critical. You can use LoadTester to simulate a spike of 500 requests per second against your checkout API, monitoring p95 latency and error rates in real time. If the system starts to buckle, the smart auto-stop feature halts the test immediately, preventing unnecessary load on your infrastructure. The run results can be exported as a PDF or CSV and shared with the engineering team to drive capacity planning and optimization efforts.
Baseline Performance Monitoring for API Endpoints
Set up scheduled daily tests for your most important API endpoints, such as authentication, search, or data retrieval. LoadTester runs these tests automatically at a specified time, storing the results for comparison. Over time, you build a performance baseline that allows you to spot gradual degradation caused by code changes, database growth, or infrastructure shifts. The regression alerts notify your team if performance drops by a defined percentage, giving you early warning before users complain.
On-Demand Load Testing for Incident Response
When your team suspects a performance issue during an incident, you can quickly launch a load test from the LoadTester console without any setup. Within seconds, you have live data showing how the endpoint behaves under controlled load. This helps you determine whether the issue is related to capacity, a recent deployment, or an external dependency. The ability to run a test instantly, without provisioning infrastructure, makes LoadTester an invaluable tool for incident response and root cause analysis.
Frequently Asked Questions
What is the difference between Virtual Users (VUs) and Requests Per Second (RPS) mode?
Virtual Users mode simulates a specific number of concurrent users making requests, each user following a defined sequence of actions. This is ideal for testing user journeys and session-based flows. Requests Per Second mode sends a fixed number of requests per second, regardless of how many virtual users are needed to achieve that rate. This mode is better for testing raw throughput and endpoint capacity. LoadTester lets you choose the mode that best matches your testing scenario.
How does LoadTester handle auto-stopping a test?
You can configure thresholds for p95 latency, error rate, or regression compared to a baseline run. When the test is running, LoadTester continuously monitors these metrics. If any threshold is breached, the platform automatically stops the test to prevent unnecessary load on your system and to avoid wasting test credits or time. You receive a notification with the reason for the stop, allowing you to immediately investigate the issue.
Can I run LoadTester tests from my CI/CD pipeline?
Yes, LoadTester is designed for CI/CD integration. You can trigger tests via webhooks, use the API to programmatically create and launch tests, or schedule them to run at specific times. The tool provides a webhook on completion, so your pipeline can wait for the test result and decide whether to proceed with a deployment based on the outcome. This makes it easy to add performance gates to your existing workflow.
What types of exports does LoadTester support?
After a test run completes, you can export the results in PDF, CSV, or JSON format. The PDF export is ideal for sharing with non-technical stakeholders or for documentation purposes. The CSV and JSON exports are perfect for importing into your own analytics tools, building custom dashboards, or performing further analysis. This flexibility ensures your team can use the data however it fits into their existing processes.
Pricing of LoadTester
LoadTester offers a free plan that lets you start testing immediately with limited concurrency and duration. Paid plans unlock higher limits for virtual users, requests per second, test duration, and team collaboration features. For specific pricing details, including current plan tiers and costs, please visit the LoadTester pricing page on their website. The free plan is generous enough to evaluate the tool thoroughly before committing to a paid tier.
Similar to LoadTester
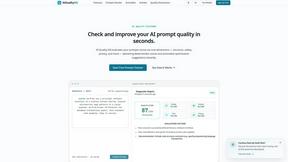
AIQualityHQ
AIQualityHQ is my go-to for instantly scoring and fixing any prompt's structure, safety, and privacy in under 10 milliseconds.

Blur & Unblur AI
Free online face blur and unblur tool with local browser processing.
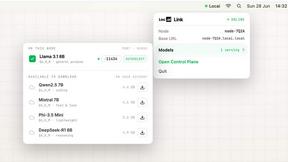
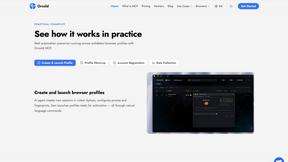
Locai
Locai lets you run powerful AI models on your own hardware, keeping data private and cutting cloud costs.

WordPalette Brand Kit
WordPalette is my favorite tool for instantly turning any word or image into a complete, private brand identity that lives entirely in your browser.